ESG data · MyReporting by BeMaterial

Collect once. Answer every request.

A platform configured to your own framework, with consulting built in. We designed it around what we saw with our clients, engagement after engagement, as they collected and processed their CSR data.

MyReporting by BeMaterial demo, 1 minute 9 seconds, no sound: data entry by entity, reminders, group consolidation, one data collection for EcoVadis, investors and the CSR report, and performance tracking.

What we see

The same material, requested five times over

Each request arrives in a different format. The substance stays the same. Click a request to see what it really asks for.

Five requests, one information base. Producing it once and adapting it to each request is exactly what we do.

Born from our client engagements

Six obstacles we saw with our clients, six answers in MyReporting

Each feature addresses a difficulty we met on engagements, in collecting and processing CSR data. Choose an obstacle to see how the tool answers it.

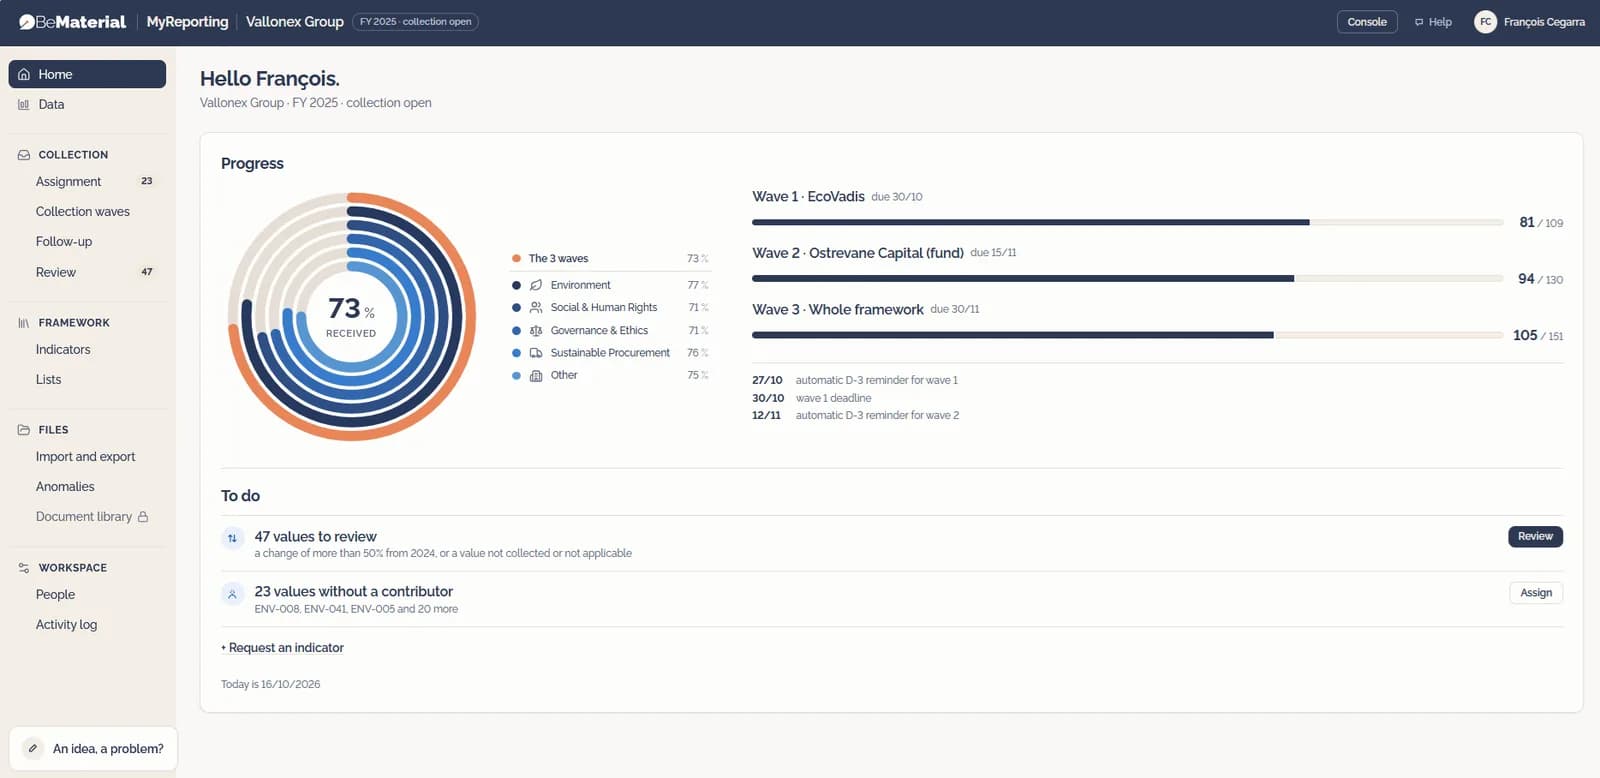
MyReporting home: collection progress and values without a contributor

Each value has an assigned contributor

Assignment links each value to a person. Values that do not yet have an owner are flagged right on the home screen.

Screenshots from a demo group.

Enter once, use everywhere

One data point, many uses

Choose an indicator: here is its sheet, and everything it feeds once collected.

Indicator sheet · example

Energy consumption

1,240MWh · 2025 financial year

Definition
Electricity, gas and fuel consumed by sites and the vehicle fleet.
Scope
All sites, calendar year.
Source
Supplier invoices and meter readings.
Owner
Facilities management.
History
2023: 1,410 · 2024: 1,315
  • EcoVadis

    Environment · Results

  • VSME

    B3 · Energy and GHG emissions

  • CSR report

    Environment chapter

  • Carbon footprint

    Scopes 1 and 2

  • Customers

    Supplier questionnaires

  • Banks and funds

    ESG reporting for banks and investors

Collected once, this figure serves 6 purposes.

Illustrative example: actual uses depend on your frameworks and on who requests your data.

Your framework, not ours

No predefined list of indicators

We start from the frameworks that apply to you and build your set of indicators: a tight selection, with nothing superfluous. Each one has its definition, its source and its owner. Figures are collected once and used everywhere.

  • EcoVadis
  • VSME
  • Your private equity investor
  • Your banks
  • Your customers
  • Your CSR report
  • Your carbon footprint
  • Your internal indicators

A platform, with consulting built in

We configure it for you, then we stay alongside you

  1. Scope

    Your frameworks, your indicators, their definitions, sources and owners. The protocol before the tool.

    Example · energy consumed, in MWh, all sites, calendar year, based on invoices.

  2. Collect

    Waves timed to your deadlines. Each contributor (HSE, HR, production, purchasing) sees what they need to report.

    Example · Lyon site, three values to enter by 15 November.

  3. Check

    Variances, missing values, incomplete figures: everything that needs verifying is flagged before it is used.

    Example · energy, Lyon site, +62% on 2024: to be checked before use.

  4. Use

    Consolidated by site and over several years, ready for EcoVadis, the VSME, your report, your customers, and your banks and investors.

    Example · a new customer questionnaire arrives; only what is specific to it remains to be collected.

Frequently asked questions

Before you start

No. We configure MyReporting to your framework and your entities, then support you in collecting and using your data. It is a platform with consulting built in.

Demo

Show us how you collect data today.

A partner walks you through MyReporting on a case similar to yours, and shows what your current files would become.